
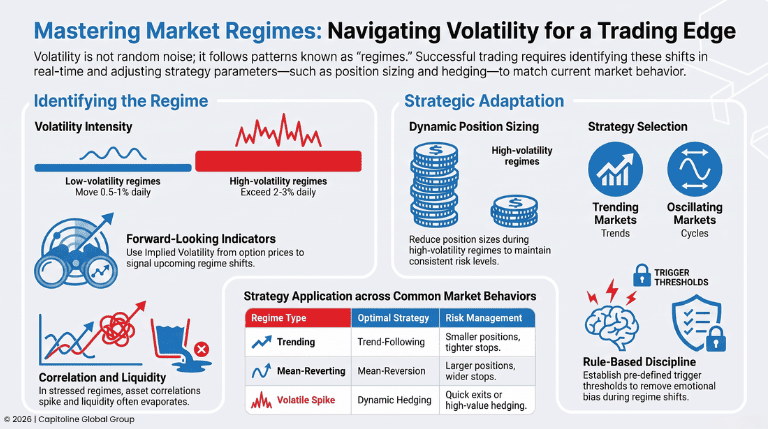
Volatility is one of the most misunderstood variables in financial markets. Traders often treat it as noise – random price movement that obscures the “real” market trends. But volatility isn’t random. It follows patterns. It shifts between regimes. Understanding volatility regimes – and building strategies that adapt to them – is one of the most consistent sources of trading edge.
Market regimes are periods when financial markets exhibit distinct behavior patterns. In a trending regime, prices move directionally and tend to continue in the same direction. In a mean-reverting regime, prices oscillate around a central level. In a volatile spike regime, prices move sharply but then revert quickly. In a low-volatility regime, prices meander with small daily swings. Each regime has different characteristics, and trading strategies that are optimal in one regime often fail in another.
The problem for traders is that markets don’t announce when they’re switching regimes. A regime that has persisted for months can shift in a single session. A trader who has built their entire business model around low-volatility mean reversion can face catastrophic losses if the market suddenly transitions to a high-volatility trending regime.
THE STRUCTURAL CHARACTERISTICS OF DIFFERENT VOLATILITY REGIMES
Volatility regimes differ in multiple dimensions, and understanding these dimensions is critical for strategy design.
Level of volatility is the most obvious characteristic: how large are typical price moves? Low-volatility regimes have daily moves of 0.5-1% of the asset price. High-volatility regimes have daily moves of 2-3% or more. Strategies that rely on large position sizes and tight stops work fine in low-volatility regimes but get stopped out constantly in high-volatility ones.
Persistence of volatility varies. In some regimes, high volatility is temporary – a spike that reverses quickly. In others, once volatility rises, it stays elevated for extended periods. A trading strategy that exits volatile periods quickly might perform well if volatility is temporary but might miss significant trends if volatility persists.
Mean reversion versus trending behavior: In some regimes, prices that move sharply revert quickly back toward their recent average. In others, they continue trending in the same direction. A mean reversion strategy buys after prices fall sharply, betting on quick recovery. That works well in mean-reverting regimes but is disastrous in trending regimes where prices continue falling.
Correlation behavior: How do different assets move together? In some regimes, assets move independently. In others, correlations spike and everything moves together. A diversified portfolio that provides excellent risk reduction in low-correlation regimes can become dangerously concentrated in high-correlation regimes.
Liquidity conditions: How easy is it to buy or sell at reasonable prices? In normal regimes, liquidity is stable. In stressed regimes, liquidity can evaporate – bid-ask spreads widen, order sizes get worse prices, and executing large positions becomes difficult. Strategies that assume stable liquidity are severely hurt by liquidity regime shifts.
IDENTIFYING REGIMES IN REAL TIME
The challenge of regime-based trading is that regimes need to be identified in real time, as they’re happening. Identifying a regime after it’s over is useless for trading purposes. Identifying it a few days late means missing the opportunity or taking losses before reacting.
The most common approach to regime identification is through volatility metrics. High realized volatility (calculated from recent price movements) is a signal that markets are in a volatile regime. Low realized volatility signals a calm regime. These metrics are backward-looking – they measure volatility that has already occurred – but they provide a useful starting point.
Implied volatility, calculated from option prices, provides a forward-looking perspective. If option traders expect elevated volatility in the coming days, implied volatility will be high even if recent realized volatility has been low. This can provide an early signal that a volatility regime shift is coming.
Volatility mean reversion can be measured: how quickly does volatility revert to its long-term average after spiking? Regimes where volatility is mean-reverting show spikes that reverse quickly. Regimes where volatility persists show spikes that stay elevated. Monitoring the autocorrelation of volatility provides a signal of which regime is operating.
Correlation patterns can be identified by monitoring how different assets move together. Regimes with low correlation show independent asset movements. Regimes with high correlation show assets moving together. This can be monitored continuously and used to adjust portfolio construction.
More sophisticated approaches use hidden Markov models or other statistical techniques to identify regimes from historical data and estimate the probability of being in each regime at any given time. These approaches are more computationally intensive but can identify regime shifts faster and with higher confidence.
BUILDING ADAPTIVE TRADING STRATEGIES
Once regimes are identified, the next step is building trading strategies that adapt to them. This can take several forms.
Regime-specific strategy selection: Different strategies are optimal in different regimes. A mean reversion strategy might be deployed in low-volatility, mean-reverting regimes. A trend-following strategy might be deployed in trending, high-volatility regimes. As regimes shift, the active strategy shifts.
Parameter adjustment: Rather than switching between entirely different strategies, parameters within a strategy can be adjusted. In mean-reverting regimes, positions might be larger and stops wider. In trending regimes, positions might be smaller and stops tighter.
Position sizing adjustment: In low-volatility regimes, larger positions can be taken because risk per unit of capital is lower. In high-volatility regimes, position sizes need to be reduced to maintain consistent risk levels.
Dynamic hedging: The hedging strategy that makes sense depends on the regime. In low-volatility regimes, the cost of hedging might not be worth the benefit. In high-volatility regimes, hedging becomes much more valuable.
The most successful adaptive strategies operate continuously: monitoring regime indicators, identifying shifts when they occur, and adjusting positions or strategies accordingly. This requires systematic execution discipline—when regime signals indicate a shift, the corresponding strategy adjustments need to be made, even if they feel uncomfortable.
THE BEHAVIORAL CHALLENGE
A significant challenge in regime-based trading is the behavioral difficulty of shifting strategies when regimes change. A strategy that has been profitable for months suddenly faces losses when the regime shifts. The temptation is to hold the strategy, assuming the recent losses are temporary and the regime shift is a temporary anomaly. This can turn a small loss into a catastrophic loss.
Successful regime traders overcome this by establishing decision rules in advance: if certain regime indicators reach certain thresholds, the strategy automatically adjusts. This removes the emotional component and ensures that strategy shifts happen at the right time, not after losses have already occurred.
THE COMPETITIVE ADVANTAGE
Regime awareness provides a consistent source of trading edge. Traders who adapt to regimes outperform those who don’t. This is true whether the strategy is mean reversion, trend following, or something else entirely. The edge comes from matching strategy to market conditions, not from the strategy itself.
Building this capability requires ongoing investment in volatility monitoring infrastructure, regime identification systems, and the discipline to execute strategy changes when regimes shift. For trading operations that make this investment, the payoff is strategies that remain profitable across market cycles rather than strategies that are great in one regime and terrible in another.